Extras
Spatial Distribution
SpatialDistribution class represents a discrete random variable whose probability distribution varies in 3-D space.
You can also think of it as a collection of different probability distributions each describing the same variable in different regions of space.
Contains three objects:
field is a
VoxelDataobject that covers a volume of spacedistributions is a pandas.DataFrame object that represents a group of discrete probability distributions
traits is a pandas.DataFrame object that represents the possible values of the variable
Each voxel from SpatialDistribution.field contains the index of a column of SpatialDistribution.distributions (a single probability distribution). Each row of distributions matches one row in SpatialDistribution.traits. Thus, when assigning a value to a position in space, we find the corresponding voxel in field and the associted distributions column containing the discrete probabilites; and then when a value is chosen, the row that corresponds can be looked up in traits.
Example
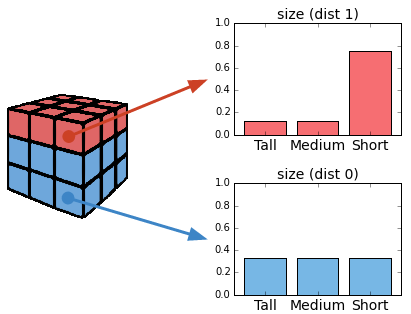
Imagine that we want to model the neurons in a piece of brain tissue. We can classify neurons by their morphology in three different types: Tall, Medium or Short. We know that these are usually equally probable in this piece of tissue but it happens that in a particular region, the type Short is much more probable than any of the other ones. We could think of two probability distributions for the same variable size: the uniform distribution (dist 0) for most of the space, and an non-uniform one (dist 1) for that particular region.
To represent this setup, we could use a SpatialDistribution object with the components:
traits: the table with each possible value of size.
size
Tall
Medium
Short
distributions: each distribution as a column. Notice how they add up to 1.
dist 0
dist 1
0.333
0.125
0.333
0.125
0.333
0.75
field: a 3-D matrix where each value is either 0 (for the uniform distribution) or 1 (for the non-uniform one).
[[1, 1, 1, 1],
 [0, 0, 0, 0],
 [0, 0, 0, 0],
 [0, 0, 0, 0], ...]
Note: The values (0, 1) refer to the column index of distributions.
The snippet of code that builds this example is:
import numpy as np
import pandas as pd

from voxcell.traits import SpatialDistribution

traits = pd.DataFrame({'size': ['Tall', 'Medium', 'Short']})

distributions = pd.DataFrame({
    0: [0.333, 0.333, 0.333],
    1: [0.125, 0.125, 0.75]
})

field = np.zeros((3, 3, 3), dtype=np.uint)
field[:, 0, :] = 1

sd = SpatialDistribution(field, distributions, traits)
Multivalue
Note that since traits is a table, we can deal with multiple properties at once.
For instance, imagine that in the previous example, we can also classify the neurons by a different criteria: whether they are Slow spiking (S) or Fast spiking (F). We don’t know the distribution for this speed variable on its own but we happen to know it for the two variables together.
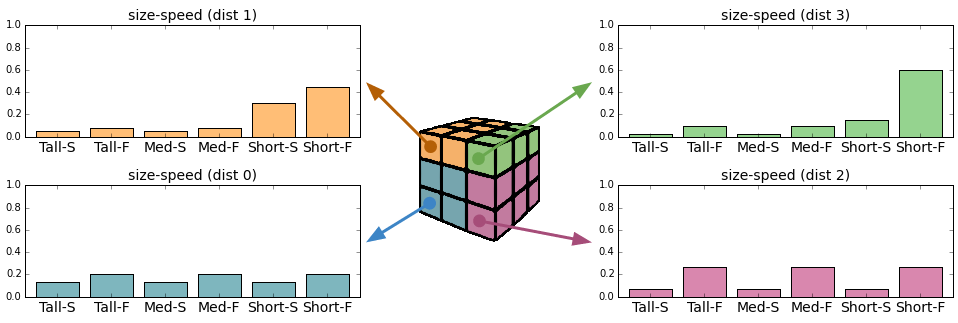
We can model this case with a single SpatialDistribution object. The traits table has one column for each variable and one row for each known combination of the values.
size
speed
Tall
Fast
Tall
Slow
Medium
Fast
Medium
Slow
Short
Fast
Short
Slow
The snippet of code that builds this example is:
 import numpy as np
 import pandas as pd

 from voxcell.traits import SpatialDistribution

 traits = pd.DataFrame({
   'size':
       ['Tall', 'Tall', 'Medium', 'Medium', 'Short', 'Short'],
   'speed':
       ['Slow', 'Fast', 'Slow', 'Fast', 'Slow', 'Fast']
 })

 distributions = pd.DataFrame({
     0: [0.1332, 0.1998, 0.1332, 0.1998, 0.1332, 0.1998],
     1: [0.05, 0.075, 0.05, 0.075, 0.3, 0.45],
     2: [0.0666, 0.2664, 0.0666, 0.2664, 0.0666, 0.2664],
     3: [0.025, 0.1, 0.025, 0.1, 0.15, 0.6]
 })

field = np.zeros((3, 3, 3), dtype=np.uint)
field[:, 0, :] = 1

sd = SpatialDistribution(field, distributions, traits)
Vector Field
TODO